Table of Contents
Percentile Walkthrough Using Actual Speed Log Data (85th percentile)
Speed percentile calculation method for traffic engineering: Aggregating binned vehicle speeds to derive 25th, 50th, 85th percentiles


There is a -M at the end of the model number for MUTCD compliant rings
This guide will walk you through calculating the percentile from speed bins captured during a given time period
Speed performance metrics for this deployment are derived from aggregated (binned) vehicle speed data recorded in defined speed ranges over fixed time intervals. The primary evaluation metric, the 85th percentile speed, is calculated using standard grouped-data traffic engineering methods based on cumulative frequency and linear interpolation within the percentile bin. This approach is widely accepted in FHWA and DOT speed-management studies when individual vehicle records are not retained. The bin resolution used provides sufficient accuracy for before-and-after speed analysis and effectiveness reporting, consistent with FHWA guidance and common practice for speed feedback sign evaluations. Raw per-vehicle speed records are not required for FHWA compliance, and the summarized speed distributions provided are adequate to assess changes in operating speeds and driver behavior.
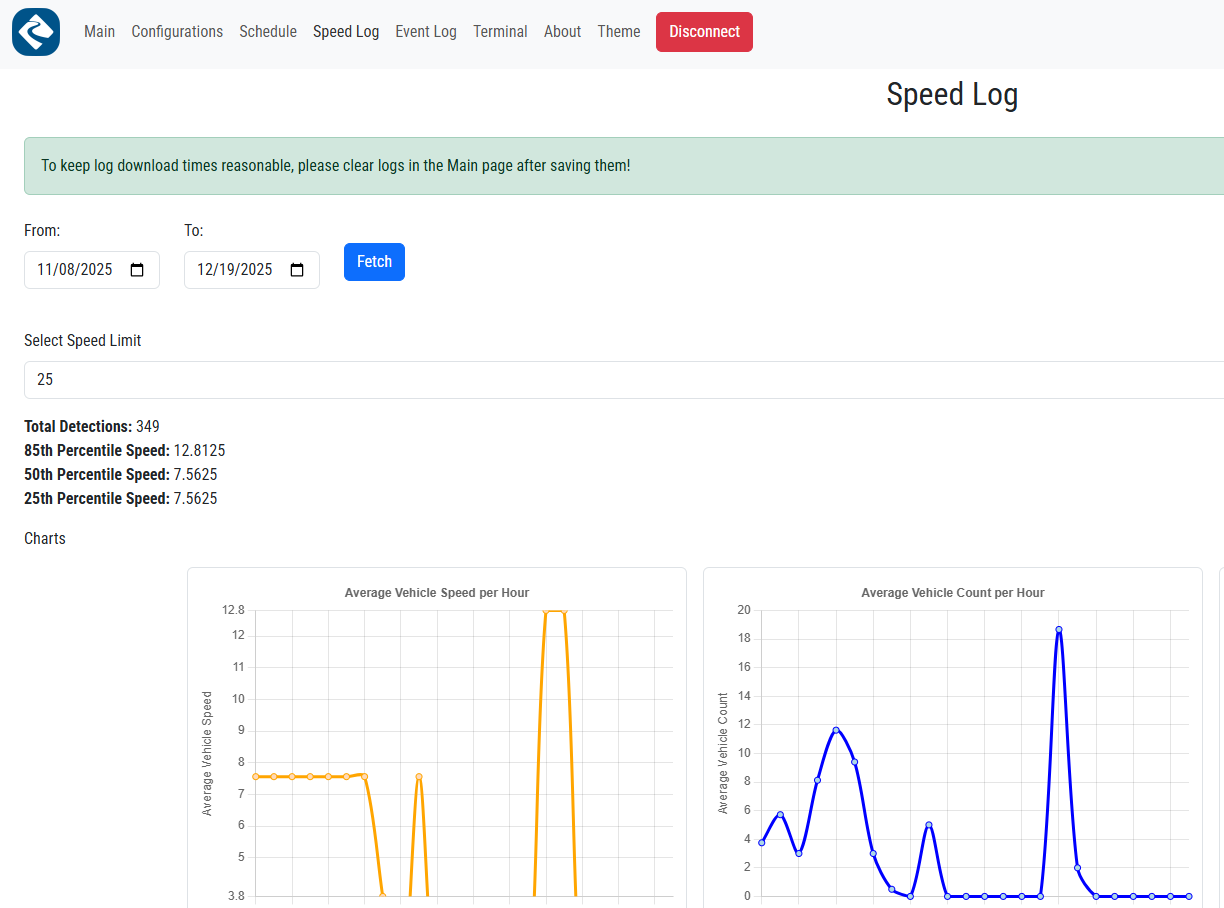
Above is the speed log we will be using for this example
1. Aggregate the Speed Bins (From the Spreadsheet)
Summing all 15-minute intervals across the file yields the following total vehicle counts by speed bin:
Speed Bin (mph) | Count (f) |
Under 1 | 0 |
1–3 | 0 |
4–6 | 250 |
7–9 | 1,071 |
10–12 | 1,108 |
13–15 | 773 |
16–17 | 329 |
18–20 | 87 |
21–23 | 13 |
30 and Over | 38 |
2. Total Vehicle Count (N)

3. Cumulative Frequency Table
Speed Bin | Lower Bound (L) | Upper Bound (U) | Width (w) | Count (f) | Cumulative (C) |
4–6 | 4 | 6 | 2 | 250 | 250 |
7–9 | 7 | 9 | 2 | 1,071 | 1,321 |
10–12 | 10 | 12 | 2 | 1,108 | 2,429 |
13–15 | 13 | 15 | 2 | 773 | 3,202 |
16–17 | 16 | 17 | 1 | 329 | 3,531 |
18–20 | 18 | 20 | 2 | 87 | 3,618 |
21–23 | 21 | 23 | 2 | 13 | 3,631 |
30+ | 30 | 35 | 5 | 38 | 3,669 |
(Bins below 4 mph had zero counts and are omitted for clarity.)
4. Percentile Index Calculations
25th Percentile

50th Percentile (Median)

85th Percentile

5. Identify the Percentile Bins
Percentile | Index (k) | Bin |
25th | 917.25 | 7–9 mph |
50th | 1834.5 | 10–12 mph |
85th | 3118.65 | 13–15 mph |
6. Interpolate Within Each Bin
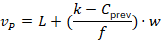
Formula Used (Grouped Data Interpolation)
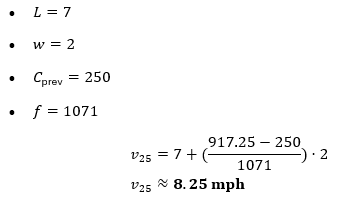
25th Percentile (7–9 mph bin)
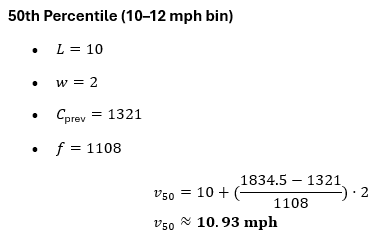
50th Percentile (10–12 mph bin)
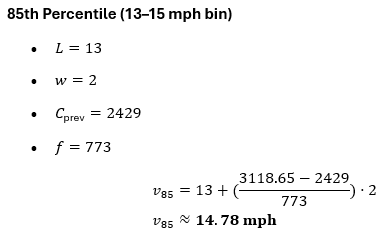
85th Percentile (13–15 mph bin)
7. Final Reportable Results (DOT-Ready)
25th Percentile Speed: 8.25 mph
50th Percentile (Median) Speed: 10.93 mph
85th Percentile Speed: 14.78 mph
Was this helpful?
TC Speed Connect User Guide (LEGACY)
TC Speed Connect (Web) Speed log